Enhancing Business Intelligence: Maven Market Data Analytics Project
In this article, we delve into a comprehensive data analytics project undertaken by me, a specialist in data analytics at Digital Rise Solutions. The project involves working with data from Maven Market, a prominent multinational grocery chain with locations in Canada, Mexico, and the United States. My objective is to analyze and derive valuable insights from the provided data to facilitate better decision-making and optimize Maven Market’s operations.
Part 1: Connecting & Shaping the Data
The first phase of the data analytics project involves connecting and shaping the raw data. The dataset is provided in the form of CSV files, containing crucial information about Maven Market’s operations, such as sales, inventory, and customer details. I use various data integration tools and techniques to combine the disparate datasets and create a unified database for analysis.
Part 2: Building a Relational Model
Once the data is consolidated, I proceed to build a relational model. This involves identifying key entities, defining their attributes, and establishing relationships between them. The relational model forms the foundation for organizing and structuring the data effectively, enabling to perform complex queries and obtain meaningful insights.
Part 3: Adding Calculated Fields
To enhance the analytical capabilities of the dataset, I incorporate calculated fields. These fields are derived from existing data using various mathematical and statistical techniques. Examples of calculated fields include profit margins, customer retention rates, and sales growth percentages. By including these calculated metrics, I gain a deeper understanding of Maven Market’s performance and uncovers valuable trends.
Part 4: Designing an Interactive Report
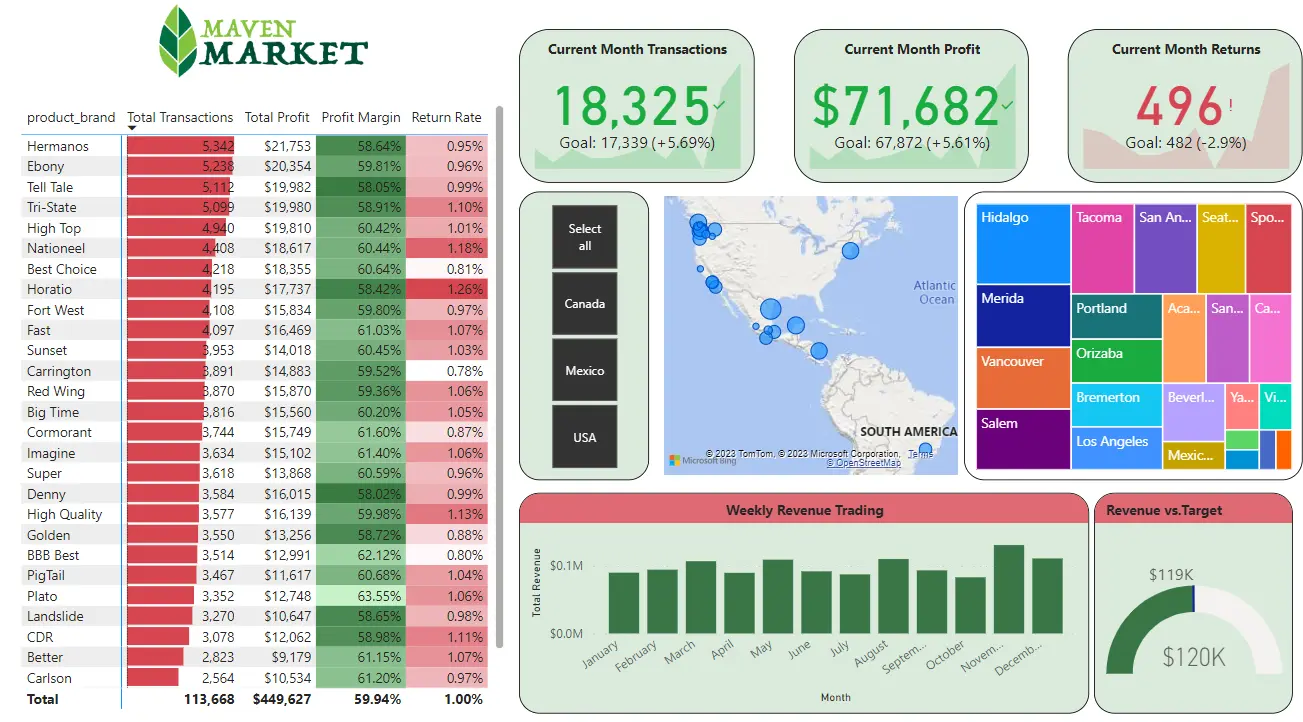
The final phase of the project involves designing an interactive report for Maven Market’s stakeholders. Leveraging data visualization tools and techniques, I create visually appealing and informative dashboards. These dashboards offer a comprehensive overview of Maven Market’s key performance indicators, sales trends, and customer behavior.
Additionally, I ensure that the interactive report allows users to explore the data and customize their analysis. This empowers Maven Market’s decision-makers to obtain real-time insights, make data-driven decisions, and identify opportunities for growth and improvement.
Conclusion
Through diligent work, expertise, and dedication, I successfully complete the Maven Market data analytics project. The project encompasses connecting and shaping the data, building a relational model, incorporating calculated fields, and designing an interactive report. The insights derived from this project empower Maven Market to optimize its operations, improve customer experiences, and make strategic decisions based on data-driven evidence.
As data analytics continues to play a vital role in today’s business landscape, My efforts exemplify the importance of leveraging data to gain a competitive advantage and achieve sustainable growth. With this expertise and innovative approach to data analytics, Maven Market is well-positioned to excel in the dynamic grocery retail industry.


SALES DASHBORD Business Analytics - Data Anlytics Tunisia
February 26, 2024[…] As the Business Intelligence Analyst at AdventureWorks Cycles, I have embarked on a transformative data analytics project in collaboration with Digital Rise Solutions. Our mission is to leverage the power of data […]